A method for linking up your demand generation and revenue generation strategies
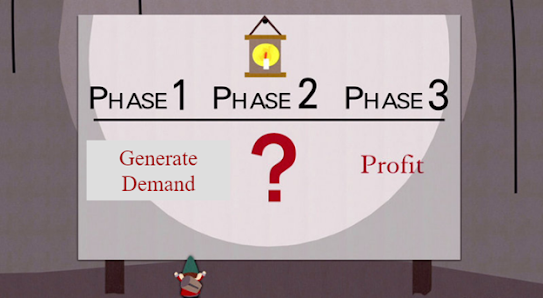
When coming up with a financial plan, at some point you’ll likely get to a confluence where you have a sense for where you want to get your startup’s revenue to and how much demand you’ll be able to generate, but you don’t know if this demand will be enough to meet your lofty revenue ambitions. At this point, planning can feel a little bit like the infamous “underpants gnomes” South Park episode.
So how do you tie these two together and can you get a sense for how these different parts fit together?
One framework you can use is to think through the efficiency with which you convert demand into revenue. How efficiently you convert demand into revenue can be expressed as a product of two factors:
Your close rate (what percentage of expressed interest do we convert to paying customers), and;
Your average transaction size (or deal value, order value, etc.)
This article will introduce a framework that will allow you to assess the feasibility of your revenue plan given your demand forecast using these two variables as guardrails.
How do we convert demand to revenue?
The revenue equation is a pretty simple thing - take the amount of demand you generate, multiply it by your close rate (the percentage of expressed interest that converts into customers) and multiply that by your average transaction size:

Oftentimes, a company's demand generation team and their revenue generation team will independently come up with targets or projections. In situations like this it’s helpful to think of how efficiently we need to convert our demand into revenue (i.e. how much revenue do we generate per unit of demand). To get to this, we just need to re-jig our equation around a bit and express it like this:

Decomposing your efficiency into a close rate and deal size is helpful for a couple of reasons:
The tactics you use to increase your close rate are often very different than the ones you would use to increase your deal size
The accountability for these metrics often sit with different teams within your company
Let's play with some numbers. Say we have a revenue goal of $1M ARR and a demand forecast of 1,000 leads from your marketing or growth team. This means that you need efficiency to be $1,000 per lead generated if we plan to generate all of our revenue from these leads.
How we get to this $1,000 per lead generated is something we now need to figure out. If we dust off our old maths textbooks, we can graph all of the feasible possibilities using an asymptotic curve like the below:

Where you want to sit on this curve will depend on how easy it is in relative terms for you to improve on either metric. The easier it is in relative terms to perform, the higher up the curve you will sit.

If we assume that you've exhausted all easy wins, and that to improve further you'll need to make trade-offs between the two. The key to this curve is that the further you go on either extreme, the smaller the marginal gains become. There are three key insights you can draw from the shape of this curve:
Perfect is the enemy of the good. Outstanding performance in one area will likely lead you to under-optimise in the other. Strong performance in both is the best path forward.
Small gains add up. Small increases in both factors compound on each other and can generate high returns.
Compromise is an opportunity. You should be willing to make trade-offs along these two dimensions if they allow you to improve efficiency overall.
This analysis is particularly useful when trying to figure out if you have enough demand to hit the revenue growth numbers you want to get to. Let’s step through a few situations.
My demand forecast won't get me to my revenue number - how can I bridge the gap?
This framework would suggest that you'll get better bang-for-buck by leaning on the lever you're relatively less efficient at. If you’re on the extreme end of the curve as it relates to your average transaction size, improving your close rate is likely going to be a much easier path to improving efficiency.
I want to try and grow revenues by an additional 10% - how can I achieve this?
If you want to grow revenue, but expect to have the same amount of demand available, the only way to get there is to become more efficient in your demand conversion. Graphically, what happens here is that your efficiency curve needs to shift out from the blue line, to the orange line:

What you then need to do is to try and figure out if moving to any point on the orange curve is feasible for you to achieve (for more reading on how to do this, see this previous post). If you think you can make the needed adjustments, you’ve a good shot of meeting your increased ambitions.
This approach is very theoretical. In reality qualitative and context-specific considerations like your pricing structure, skill of your sales team, and other factors are significant considerations in your decision making too. However, anchoring your thought process in an analytical and structured fashion such as this is a helpful baseline before layering in the more qualitative factors, and can help bring more rigour to your planning and forecasting process.


Gosh, how do you find the time to blog?
ReplyDeleteI could ask you the same question! I am a layabout student after all :) Thanks for taking a look Prof.
DeleteI often stare at different ratios around how efficiently I turn marketing dollars into revenue per channel and a bunch of more specific measures of things that make up "Close Rate". Do you know of any articles or ways to think of how to best define Close Rates Overall and/or per demand generation channel?
ReplyDeleteThanks for the comment! You're dead right - thinking of marketing dollars spent per dollar of revenue is a big topic and broader than this post alone. In a way it combines two different, and difficult, topics -- one is how efficiently you're converting demand into revenue (which this article discusses) and the second is how much you're spending in order to acquire a unit of demand (which isn't covered explicitly in this article).
DeleteHow you're defining close rates will depend on how you want to "attribute" dollars of revenue to different sources. There a few different options on how to do it with different sets of pros and cons. Where you land is pretty situation specific, but I've outlined the options at a high-level in the post below - hope it's helpful!
https://dahrahrah.blogspot.com/2020/08/what-is-revenue-attribution-and-why-is.html